SacL5 Web Site Traffic Report – Mission Day: 2,592
November 14, 2026
Visits / Page Views:
• 1,606 (−1,191) last 30 days
• 14,516 (−186) last 12 months
• 38,764 (+2,148) since October 10, 2019
Changes are measured against the October 10, 2026 report. The daily and annual charts end November 13. The live summary and cumulative counter were captured November 14 at approximately 2:43 p.m. Pacific and include a partial day.
Sacramento L5 Society Website Activity — Since October 10
The cumulative counter increased from 36,616 to 38,764, adding 2,148 page views, an increase of 5.9%. This is the difference between two report snapshots.
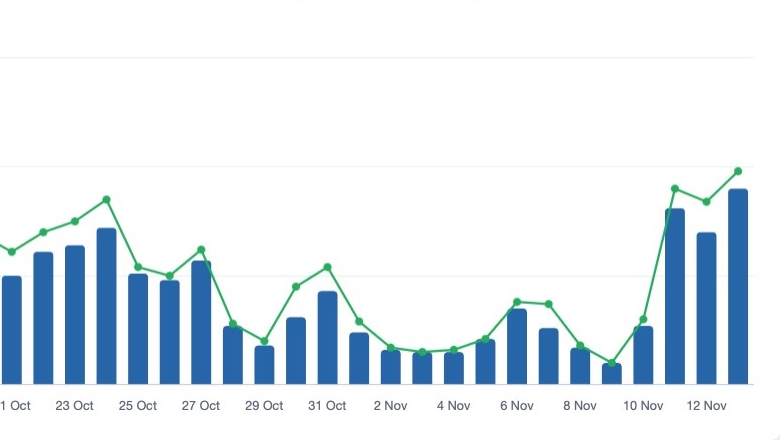
The completed 34-day period October 11–November 13 recorded 2,036 page views and 1,832 visitors, averaging 59.9 page views per day. This exact custom-period total differs from the cumulative increase because the snapshots include partial reporting days. Subtracting November 14’s 52 page views gives a cumulative total of 38,712 through November 13, or 2,096 above the October snapshot.

Visitor Traffic plugin: October 11–November 13, 2026. Blue bars show visitors; the green line shows page views. Original dashboard capture.
30-Day Website Activity
The live rolling 30-day total reached 1,606 page views, compared with 2,797 in October, a decrease of 1,191 (42.6%). Visitors decreased from 2,507 to 1,434, down 1,073 (42.8%). This rolling window is separate from the 34-day report interval and includes the current partial day.
The daily graph shows higher traffic in mid-October, lower levels in early November, and a rise during November 11–13.
Rolling 12-Month Traffic
The exact custom range November 14, 2025–November 13, 2026 recorded 14,516 page views and 13,321 visitors. Compared with October’s annual totals of 14,702 visits and 13,611 visitors, these are decreases of 186 (1.3%) and 290 (2.1%), respectively.

Rolling annual traffic: November 14, 2025–November 13, 2026. Totals come from this exact custom chart range.
The updated dashboard labels its summary’s annual row “This Year.” That row is reproduced below as displayed and is not used as the rolling-year total. October used the plugin’s former “Last 12 months” summary row; this comparison therefore spans a change in the dashboard’s labeling and presentation.
Cumulative Summary
The live cumulative summary shows 34,230 visitors and 38,764 page views. Compared with October’s 32,299 visitors and 36,616 visits, those totals increased by 1,931 (6.0%) and 2,148 (5.9%), respectively.
| Period | Visitors | Page Views |
|---|---|---|
| Today (November 14, partial) | 48 | 52 |
| Yesterday (November 13) | 90 | 98 |
| Last 7 days | 343 | 382 |
| Last 30 days | 1,434 | 1,606 |
| This Year (dashboard label) | 13,329 | 14,525 |
| Total | 34,230 | 38,764 |

Summary Statistics captured November 14, 2026, approximately 2:43 p.m. Pacific. Today is partial.
Source and Access Limits
Source: the authenticated WordPress Visitor Traffic Real Time Statistics Free dashboard. The current dashboard labels traffic “Page Views”; October’s summary called it “Visits.” The title retains the report’s established convention. Counts should not be interpreted as independently verified unique people.
The graphs are dashboard captures, not reconstructed or estimated daily data. Full country rankings and detailed traffic-source history remain restricted to Pro. Traffic counts alone do not establish which chapter activities caused changes or how much traffic came from human readers.
Previous report: SacL5 Website Traffic Report 10/10/26.