SacL5 Web Site Traffic Report – Mission Day: 2,557
October 10, 2026
Visits:
- 2,797 (+1,676) last 30 days
- 14,702 (+2,147) last 12 months
- 36,616 (+2,729) since Oct. 10, 2019
Changes are measured against the September 12, 2026 report. October 10 is a partial day at the time of retrieval.
Sacramento L5 Society Website Activity — Since September 12
The cumulative visit counter increased from 33,887 to 36,616, adding 2,729 visits since the September 12 report, an increase of 8.1%. This is the difference between two report snapshots; it is not a separately exported custom-period total.
The chart below covers September 13 through October 10, 2026, beginning the day after the previous report. The cumulative difference can also include traffic later on September 12 after that report’s snapshot.
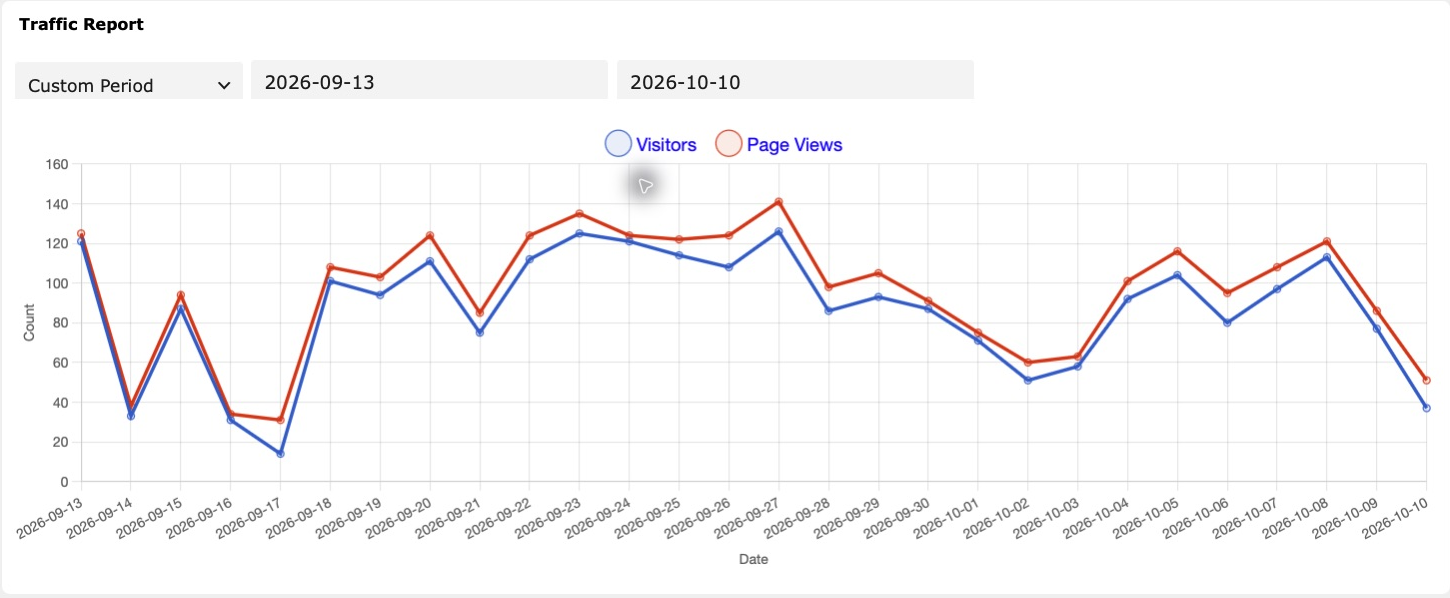
30-Day Website Activity
The rolling 30-day total reached 2,797 visits, compared with 1,121 in the September report. The gain of 1,676 represents a 149.5% increase. The plugin reports 2,507 visitors during the same rolling window, compared with 1,032 previously, an increase of 1,475 (142.9%).
The rolling 30-day window differs from the period since the previous report, which was 28 days ago. These totals should therefore be kept separate. The daily chart shows several elevated stretches in late September and early October, with lower days between them.
Rolling 12-Month Traffic
The rolling annual total increased from 12,555 to 14,702 visits, a gain of 2,147 (17.1%). The current annual visitor total is 13,611. Because older days leave a rolling window as new days enter it, the annual increase differs from the cumulative increase.
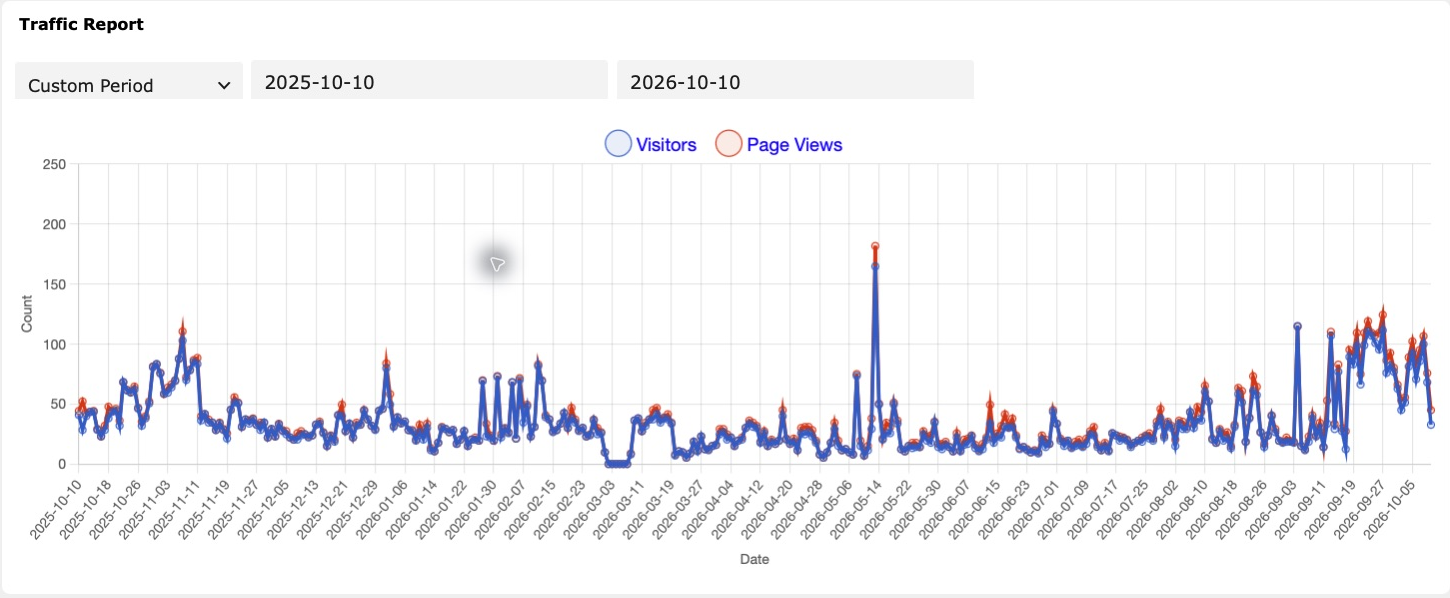
The annual chart shows recent traffic at a higher level than much of the preceding year. Traffic counts alone do not establish which chapter activities produced the increase or how much traffic came from human readers.
Cumulative Summary
October 10 marks seven years since the tracking start date used in previous reports. The plugin’s cumulative summary shows 32,299 visitors and 36,616 visits.
| Period | Visitors | Visits |
|---|---|---|
| Today (partial) | 37 | 51 |
| Yesterday | 77 | 86 |
| Last 7 days | 658 | 741 |
| Last 30 days | 2,507 | 2,797 |
| Last 12 months | 13,611 | 14,702 |
| Total | 32,299 | 36,616 |
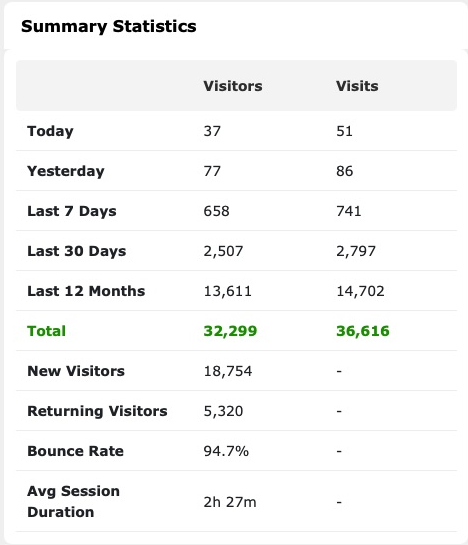
The plugin also displays 18,754 new visitors, 5,320 returning visitors, a 94.7% bounce rate, and an average session duration of 2h 27m. These are reproduced as displayed; their measurement scope and definitions were not independently verified, and the new/returning figures do not reconcile to the total visitor count.
Source and Access Limits
Source: the authenticated WordPress Visitor Traffic Real Time Statistics Free dashboard, retrieved October 10, 2026. The summary calls the traffic column “Visits,” while the charts label it “Page Views”; this report preserves those labels. Visitor counts should not be interpreted as independently verified unique people.
The free plugin restricts full country-level history, referring-country rankings, and detailed traffic-source breakdowns to Pro. Those inaccessible analytics are not included. The charts are dashboard captures, not reconstructed or estimated daily data.
Previous report: SacL5 Website Traffic Report 9/12/26.